Analytics & statistics
Track live floor activity, packing trends, and station cycle times.
Analytics has three pages, and each one answers a single question. Open them from the sidebar under Analytics, or go straight to the page you need.
Everything on these pages covers the active organization only. Use the organization switcher if you work across more than one.
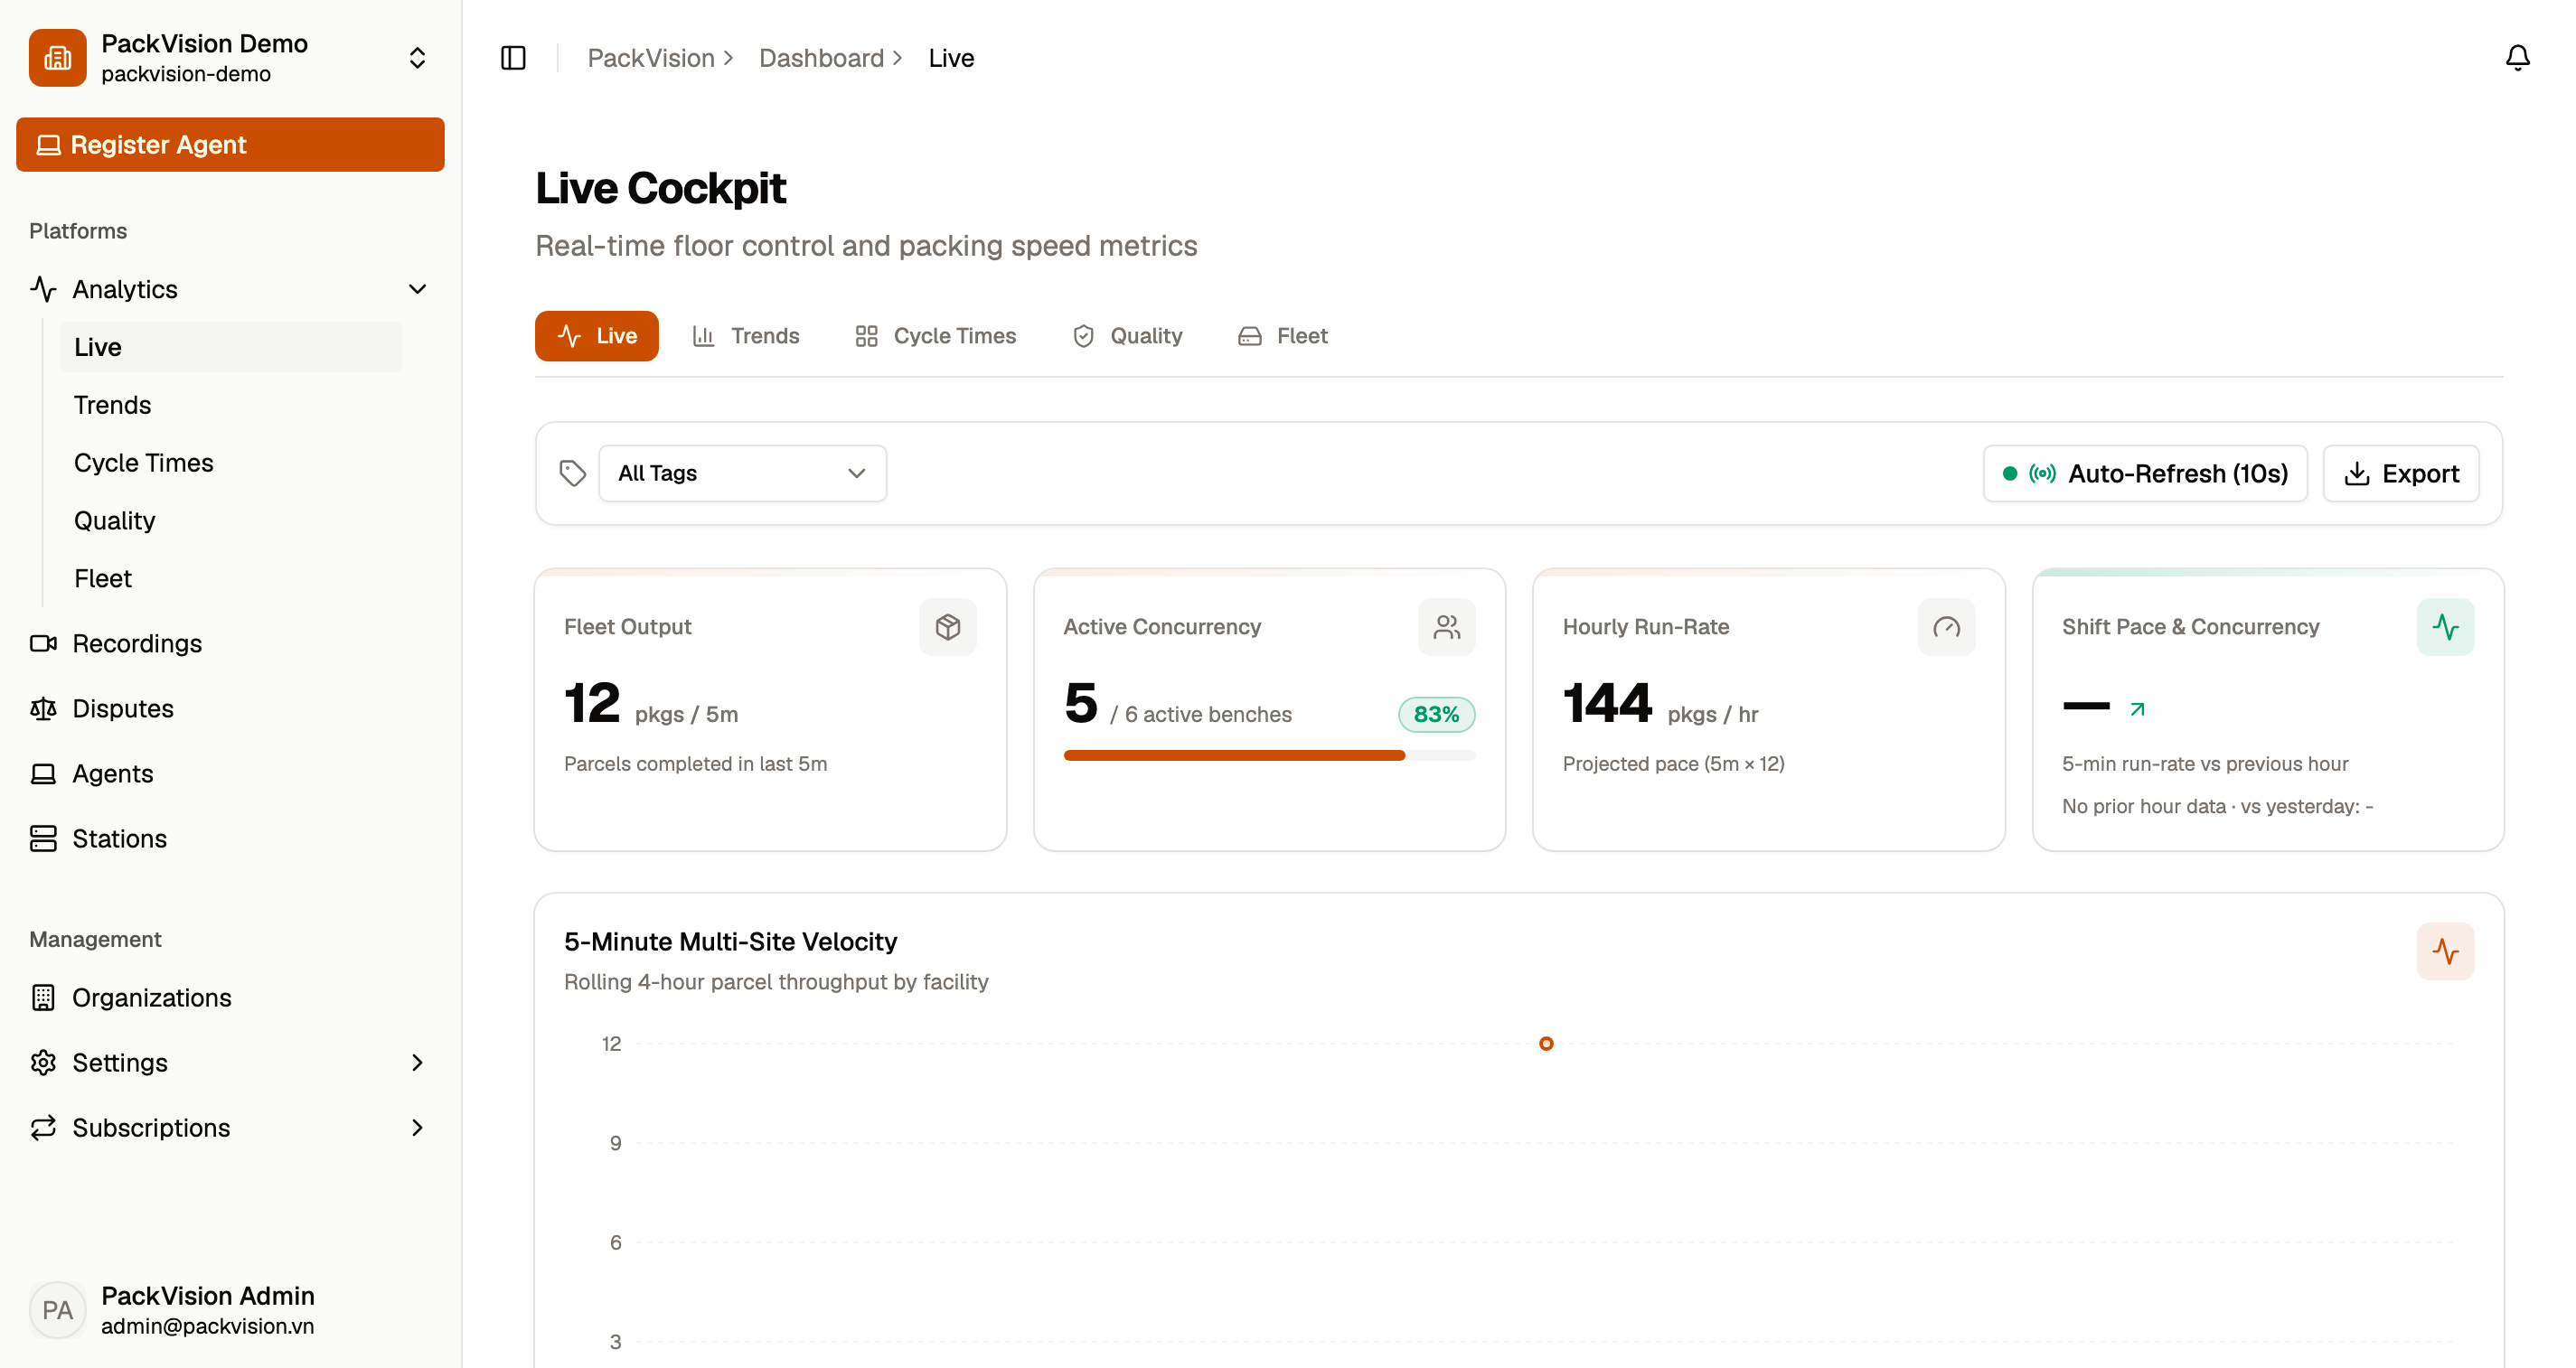
Live floor
Live floor answers: is the floor running, and who needs help now?
Three numbers sit above the station table:
- Packed, last 5 min — parcels recorded in the rolling five minutes.
- Benches active — stations that packed at least one parcel in the last five minutes, out of all stations.
- Needs attention — benches idle for 15 minutes or more, plus stations that have not reported in for more than 15 minutes.
The table lists the benches that need help first, then the benches that are packing. Leave Auto-refresh (10s) on while you watch the floor, and turn it off while you read or share the screen.
On a tablet, scroll the station table sideways if you need the far columns. The three numbers stay at the top and remain visible.
Trends
Trends answers: are we up or down against the previous period, and which site is behind?
- Packed volume — orders packed in the selected period, with the change against the previous period of the same length.
- Average per day — volume divided by the number of days in the period.
- Dispute rate — claims divided by orders for the same period.
The Daily volume chart shows completed and pending orders for each day. The site benchmark table compares volume, active station hours, output per active station hour, and dispute rate for every site.
Stations
Stations answers: where do the seconds go — is the bench packing or waiting?
One summary sentence describes the period: average pack time, average wait time, and how many stations contributed. Below it, the cycle-time distribution shows how parcels spread across fast, standard, long, and very long packs, and the station leaderboard ranks each bench by volume, active utilisation, pack time, and wait time.
Select a Tag to narrow the summary, the histogram, and the leaderboard.
Filters
The filter bar at the top of the page offers:
- Tag — scope every block to one station tag, such as a site, a lane, or a product group.
- Time Horizon — Today, Last 7 days, or Last 30 days.
- Auto-refresh (10s) — on the Live floor page only.
- Export CSV — download the current table.
The selected tag and range stay in the address bar, so the link you copy opens the same view.
Where quality and fleet health live
- Disputes (
/app/disputes) opens with three numbers for Last 30 days: Open disputes, Evidence coverage (disputed orders that have a saved cloud clip), and Win rate. See Disputes. - Stations (
/app/stations) shows camera, disk, and heartbeat health for every station. See Stations. - Agents (
/app/agents) shows data transfer and cloud storage used against your allowance. See Agents.
Reading the numbers
| Number | What it means |
|---|---|
| Packed, last 5 min | A rolling five-minute count, not an hourly rate. |
| Benches active | Stations with at least one parcel in the last five minutes, over all stations. |
| Needs attention | Benches idle 15 minutes or more, plus stations offline longer than 15 minutes. |
| Volume | Orders created in the selected period, compared with the previous period of the same length. |
| Average per day | Volume divided by the days in the period. |
| Dispute rate | Claims divided by orders, both counted from the order date. |
| Pack time / wait time | Average packing time and the average gap between parcels; waits over one hour are ignored. |
| Output per active station hour | Parcels divided by station hours that contain at least one parcel. |
A value with no data shows — with a one-line reason, never 0 or a
percentage built from zero.
Watching recordings inside the warehouse network is free; only remote streaming uses your data transfer allowance.
Use station tags consistently so tag filters and site comparisons stay meaningful.
Next steps
- Organizations — switch the active organization.
- Team — invite people to help review operations.